
Diffraction
If a wave is incident on a grating which has a sinusoidal transmittance profile,
three exit waves are produced. This is the case whether it be
electromagnetic waves, electrons, light, or even water waves. This effect is
known as diffraction.
Understanding diffraction provides an interesting insight to how information
about an object is encoded into light which is scattered by it. Huygens model of
wave propagation, though good for explaining reflection and refraction, does not
give a very good insight into diffraction. A very interesting alternative method
is that of fourier optics. I hasten to add, before you click your 'Back' button,
that very little mathematics is required.
How Diffraction Works
Diffraction can be better understood with a couple of diagrams and a little
trigonometry. The following description uses light waves but it is equally
applicable to other waves.
The top graph on the left shows the E field of the light across the exit side
of the grating. You have to imagine that it is oscillating up and down at the
frequency of the light (about 4x10¹⁴ times a second). It is the input
beam multiplied by the sinusoidal transmittance profile of the grating.
The top graph can be broken down into two sum components. These are shown in the
middle and bottom graphs.
The first component (middle graph) is just an attenuated
version of the input wave. It therefore exits the grating travelling in the same
direction as the input beam.
The second component (bottom graph) is a standing wave. A standing wave is made
up of two waves traveling in opposite directions. The period of this standing wave
is that of the grating (d). The period of the light cannot change though. The only
way that this can be so, is by the two waves traveling away from the grating at
equal and opposite angles.
So the top graph represents three exit beams; one straight through, and two at
equal but opposite angles.
To see what the exit angles will be, a little trigonometry is required, as shown
in the following diagram:
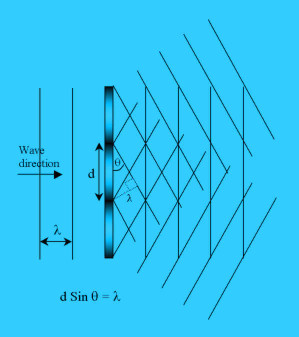 The diagram on the left shows a beam of wavelength lambda approaching a sinusoidal
grating at a normal to it. It leaves the grating as three beams as explained above.
The diagram on the left shows a beam of wavelength lambda approaching a sinusoidal
grating at a normal to it. It leaves the grating as three beams as explained above.
The angles of the beams have to be such that the standing wave across the grating
has the same period (d) as the grating, as can be seen in the diagram.
From the construction, it can be seen that the grating period (d) multiplied by
the sin of the angle between a wavefront and the grating (θ) is equal to the
wavelength of the light (λ). The angle between an exit beam and the grating
is 90o-(180o-90o-θ) = θ.
This gives the relationship d Sin θ = λ.
Practical Investigation
Further insight can be gained by looking at the diffraction patterns created by
simple objects. To make the diffraction patterns as simple as possible,
monochromatic coherent light should be used. A low powered laser is ideal for
this.
All that is required is a helium/neon laser or visible laser diode, a
transmission type object and a screen. The screen can be a sheet of white card.
A laser pointer would probably work although I have not tried it.
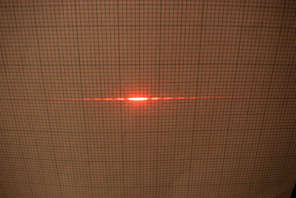
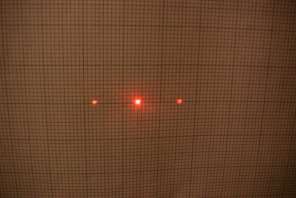 From the above theory, you should be able to guess what object made this
diffraction pattern. The object was a sinusoidal grating made using the
same technique used for a simple transmission hologram, but with an
unmodulated object beam. The sinusoidal
interference pattern crated by the two beams was recorded on the film.
From the above theory, you should be able to guess what object made this
diffraction pattern. The object was a sinusoidal grating made using the
same technique used for a simple transmission hologram, but with an
unmodulated object beam. The sinusoidal
interference pattern crated by the two beams was recorded on the film.
In holographic terminology, one side spot is the real image of the object
beam and the other is the pseudoscopic image.
The distance from the grating to the screen was 410mm and the spots are
23mm apart. Therefore the deflection angle θ = tan-1(23/410)
= 3.2o. The laser was a helium/neon type, with a wavelength of
633nm. Using the formula d Sin θ = λ, the grating period
d = 630nm / sin 3.2 = 11μm.
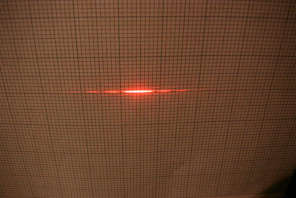
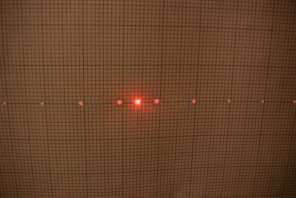 How can this diffraction pattern be explained by the theory developed so far?
Well the middle three spots could have been created by the sinusoidal grating
used for the previous pattern. The next pair of spots from the centre could have
been produced by a sinusoidal grating with one third the period and the next pair by
one fifth the period.
How can this diffraction pattern be explained by the theory developed so far?
Well the middle three spots could have been created by the sinusoidal grating
used for the previous pattern. The next pair of spots from the centre could have
been produced by a sinusoidal grating with one third the period and the next pair by
one fifth the period.
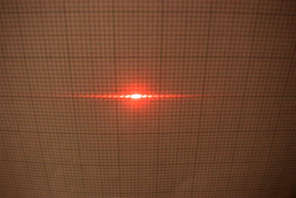
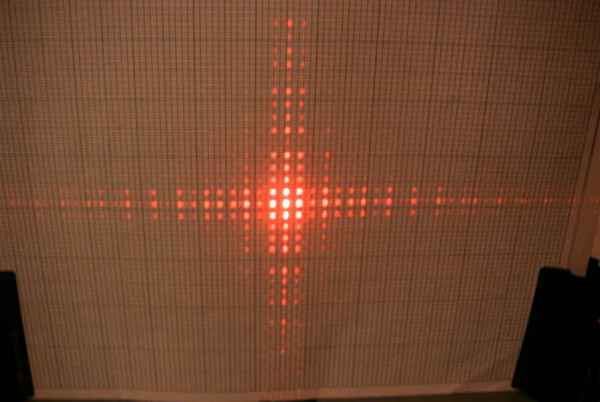
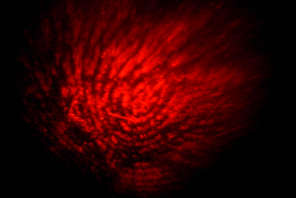
This is where it gets interesting. This is the diffraction pattern produced by
a square wave grating with equal mark to space ratio. The square wave consists of
a fundamental frequency and an infinite number of odd harmonics, each producing a
pair of spots in the diffraction pattern. So a diffraction pattern is a fourier
transform of the object. Each pair of spots represents a spacial frequency of
the object.
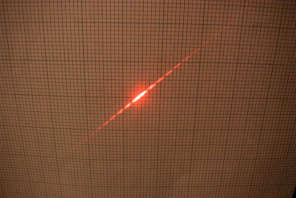
 This is the diffraction pattern created by a vertical slit. The slit object was
simply two Stanley knife blades attached to a magnet.
This is the diffraction pattern created by a vertical slit. The slit object was
simply two Stanley knife blades attached to a magnet.
The important points to note are that the diffraction pattern of a vertical
slit causes only horizontal deflection in the diffraction pattern and that the
pattern consists of a central bright line and then many shorter 'dashes' fading
out in either direction. The fourier transform of a 'top hat' function (the slit)
is a sinc function. Because you can only see intensity variations, the diffraction
pattern resembles a sinc2 function.
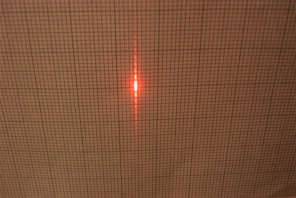
When the slit is made narrower, the dashes get longer and move further apart
as in the following two pictures.
Rotating the slit, rotates the diffraction pattern as shown below. In the
left hand picture, the slit is at 45o. In the right hand picture
the slit is horizontal.
Altering the Diffraction Pattern (Spacial Filtering)
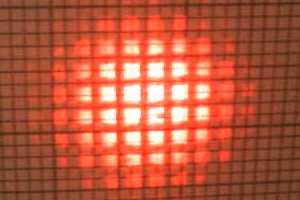
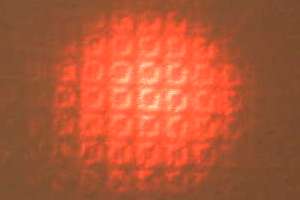
The above picture is the diffraction pattern of a fine wire mesh. The mesh is
constructed from horizontal and vertical wires, equally spaced apart. The diffraction
pattern therefore mainly contains information in the horizontal and vertical
directions. There are spots for all harmonics of the mesh period because the
mark to space ratio is not 1:1. The mesh to screen distance was 1.17 meters.
The largest squares on the grid are 20mm wide, so there are about 2.5 spots per
cm. I have worked out that the wire spacing (period) in the mesh is about 0.18mm.
 This is a simple setup for spacial filtering.
A lens produces a diffraction pattern in the back focal plane. An image
is produced on a distant screen. The diffraction pattern can then be
altered using masks and the result on the image observed.
 This is an image of the mesh. The diffraction pattern has not been altered
in any way.
This is an image of the mesh. The diffraction pattern has not been altered
in any way.
 This is the image after the horizontal spacial frequency information has been
removed from the diffraction plane using a pair of blades as a mask.
This is the image after the horizontal spacial frequency information has been
removed from the diffraction plane using a pair of blades as a mask.
 This is the image after the low spacial frequencies have been removed. The
squares are no longer 'filled in' fully.
This is the image after the low spacial frequencies have been removed. The
squares are no longer 'filled in' fully.
This is the result of removing the central portion of the diffraction
pattern with a mask.
Imaging Phase Objects by Spacial Filtering
A fingerprint is almost invisible to the naked eye. This is because it
is a phase object. It causes phase shifts in the light due to the thickness
of the oil, but does not cause much intensity variation.
A phase object causes diffraction in a similar way to an amplitude object.
It can be rendered visible by using a high pass spacial filter. All that is
required is a 'stop' in the center of the diffraction pattern to remove the
zero and low spacial frequencies.
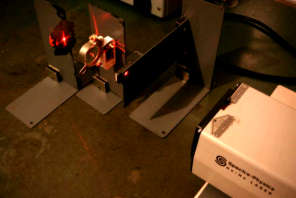
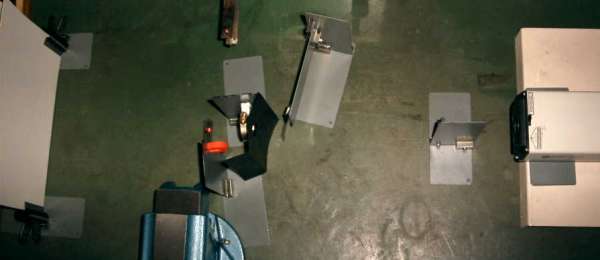
My spacial filter lash up is shown in the picture above. The laser is on
the right and the screen on the left. The grey things are home made magnetic
stands. Immediately to the left of the laser is a diverging lens so that the
laser beam illuminates the whole object. The next stand to the left holds the
object which is a piece of film with a finger print on it. Next there is a
card mask to block light which would otherwise pass around the outside of
the next lens. The lens immediately to the left of the card mask produces a
diffraction pattern of the fingerprint in its back focal plane. The center
of the diffraction pattern is removed by a small spot of Blu-Tack attached
to a piece of clear plastic film. The orange thing is just a magnet holding
the film to the stand. The image is then formed on the screen on the far left.
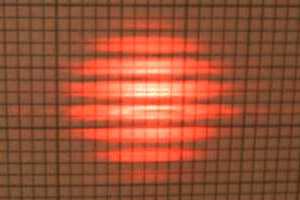
 This is the image of the fingerprint after spacial filtering. The background
appears black because the photograph was taken with the room lights off to
improve the contrast.
This is the image of the fingerprint after spacial filtering. The background
appears black because the photograph was taken with the room lights off to
improve the contrast.
This type of filtering is called the dark field technique.
Information about diffraction as it applies to individual photons is on the
Young's Slits
page. The Young's slits single photon diffraction experiment is also provided live
online (not a simulation). For the experiment, you will require Java and some
patience.